Tags: Assessment, Collaborative Learning, Interaction, Peer-Reviewed Entry, Social Presence

Description
Traditional gallery walks let students stroll through the classroom viewing their peers’ work, which is often set up on the top of their desks. At its heart, a gallery walk is an interactive, discussion technique where students move around the room, actively analyze information, and provide peers with feedback about their work (Fasse & Kolodner, 2000; Francek, 2006; Gooding & Metz, 2011). Like their namesake in the art world, a gallery walk can be used to display a range of student learning artifacts, including visuals made on poster boards to research reports and 3D models. After the artifacts are displayed, students view, read, and analyze their peers’ work and offer feedback in the form of short notes or verbal comments. In the feedback, students document the information they learned from the artifact along with offering ideas for improving it.
Collaborative learning technologies (CLTs) that allow multiple students to access, develop, and edit the same document, presentation, or platform provide unique opportunities for feedback. Because several students can simultaneously manipulate these CLTs, they are able to add links, images, and audio recordings to them. Course instructors can utilize these CLTs by layering them together to create student-to-student interaction. For example, multiple students can all log onto the same Google Slides presentation and add to it in real time. Furthermore, with researchers identifying quick, explicit feedback as being a key factor for student success when using technology (Gaytan & McEwen, 2007; Moore-Adams, Jones, & Cohen, 2016), the use of CLTs to digitalize the gallery walk strategy has positive implications for the online classroom and blended learning activities.
By creating a gallery walk using CLTs, students can access their peers’ content and provide feedback and discussion in real time. With CLTs rising in popularity and being blended into classroom instruction (Oreskovic, 2010), practitioners have the opportunity to layer these CLTs together. For example, instead of displaying artifacts on poster board, paper, or canvas, students in an online environment can first create a digital learning artifact such as an infographic, slideshow movie, or web flyer and then post a link to it using a CLT. In this manner, the CLTs become a platform for students to embed or link artifacts for virtual gallery walks. Example CLTs that can be used for these purposes include Padlet, Google Slides, and Dotstorming, among several additional options. Students then partake in a virtual gallery walk by scrolling through the CLT and clicking the different content embedded or linked to it. After viewing their peers’ work, students can offer feedback by typing it directly back into the CLTs as a new post, reply, or comment, or by uploading it into a digital dropbox, such as a Google Form.
Examples & Artifacts
To make a gallery walk in an online class, the instructor should first choose the CLT that will house where the artifacts will be posted or linked (e.g., Google Slides, Padlet, Dotstorming,). The instructor then takes time to format how the students are to share their artifact, so there is a clear place for them to post their work or link to their work along with feedback from their peers.
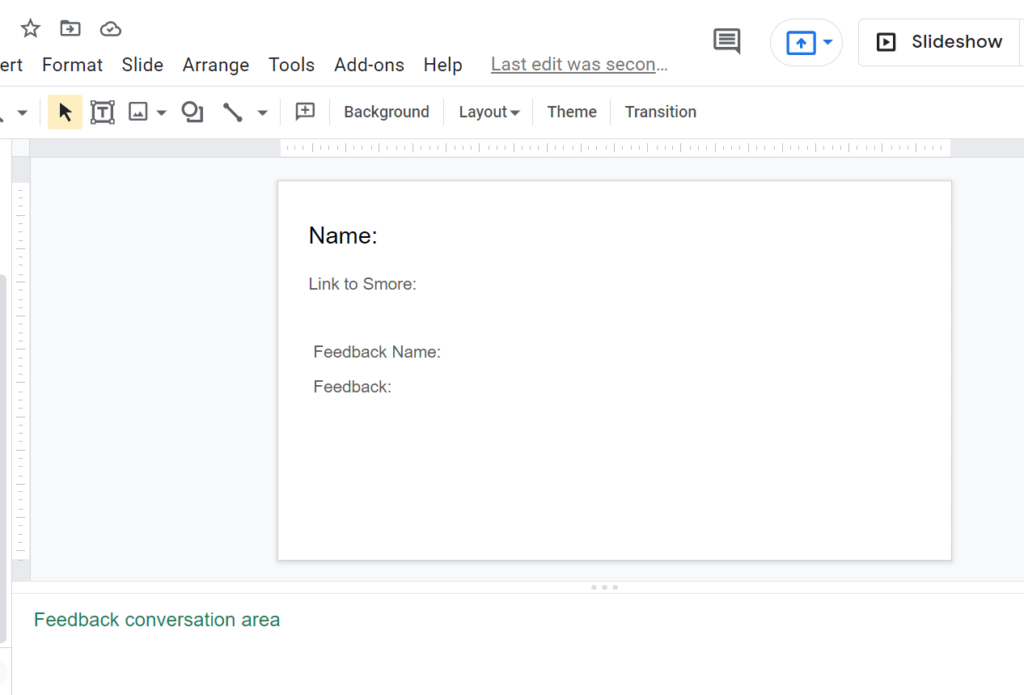
When creating the space for students to share their work, it is crucial that a method for linking the artifact along with a place for providing feedback and the contributors’ names are included in a template (Artifact 1).
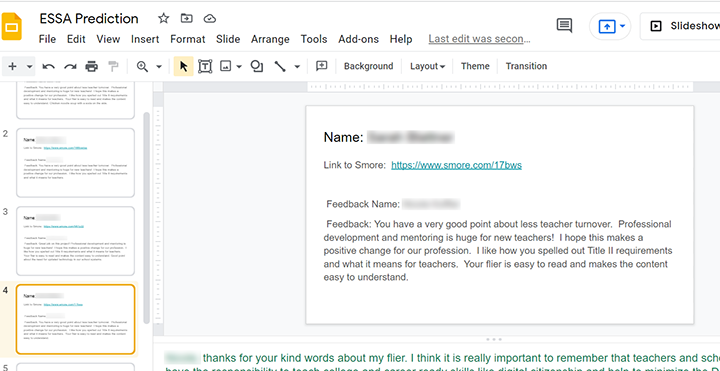
Next, the instructor provides students access to the CLT and instructions for the gallery walk. Students then create their own artifact to be displayed as part of the gallery walk. To share it, students usually post a link to the artifact or embed it directly into the CLT, which layers the artifact into the CLT. Once students have posted their work, the instructor should ensure that all links are valid or that the artifacts are correctly embedded. Students are then instructed to write feedback to one or more of their peers either directly in the CLT or in the “Comments” section below it, and the feedback can include compliments, critiques, and suggestions for improvement (Artifact 2).
In the example previously described, the instructor was teaching a graduate-level course in education. The course enrolled 20 students who were licensed, in-service teachers, and the course was completely online. The instructor routinely introduced new technologies to the students to establish a culture where using new technologies was part of the learning process. To support their learning, he made a brief video overview of the technology to be used and his expectations for completing the assignment along with a model of it. The digital gallery walk described here was implemented after students demonstrated competency for using new technologies.
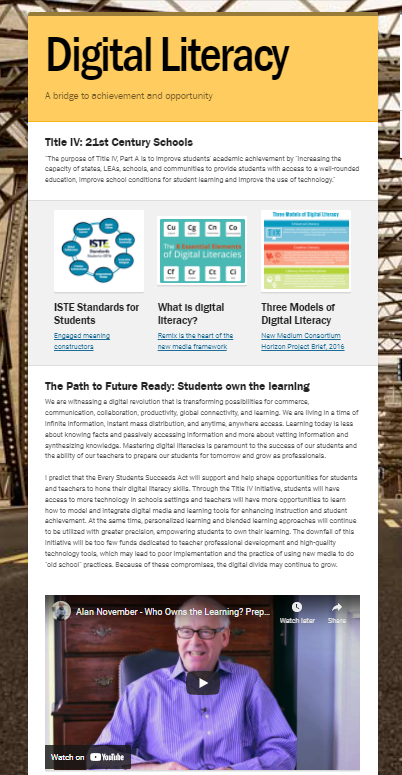
For this gallery walk, the students were asked to create an infographic using the Smore website about the implications of the Every Student Succeeds Act on literacy education. As part of their infographic (Artifact 3), students had to include text, images, and videos. After creating it, students shared their infographic by posting a link to it on the Google Slide. After all students posted their infographic and the instructor ensured that the links were valid, the students viewed their peers’ works and wrote feedback.
Artifact 1. Template provided by the teacher.

Artifact 2. A student’s linked artifact in the CLT template accompanied by student feedback.

Artifact 3. A student’s multimedia infographic linked from the gallery walk.

Leverage Digital Gallery Walks for a Business Curriculum
While schools and colleges of education can leverage digital gallery walks, by making small modifications, this strategy can also be used for preparing majors in other areas, such as business. For example, a business instructor can have their students read a case study about a company. Next, the instructor can create a digital gallery walk using the previously described procedure and have their students take the role of the employees from the case study. Next, the instructor can have their students complete a Strengths, Weaknesses, Opportunities, and Threats (SWOT) analysis – a commonly used method for evaluating a company’s assets and deficits (Leigh, 2009) – in an organizer on their slide of the gallery walk about the company, as shown in Figure 1. In addition, the instructor can choose to have their students complete their SWOT analysis and then copy it onto the gallery walk slides or complete it directly on the slides, as there are benefits and shortcomings to having the students look at their classmates’ analyses while creating their own.
Figure 1.
Template for conducting a SWOT analysis, adapted from Leigh (2009)
| Assets | Deficits | |
| Internal | Strengths | Weaknesses |
| External | Opportunities | Threats |
In addition to SWOT analyses, business courses can use this strategy for other purposes, such as using templates to create personas of potential customers for a company, completing charts to evaluate costs structures and revenue streams of a for-profit company compared to a non-profit organization, and sketching prototypes to ideate future products for a startup. Across these ideas, a main benefit is that the instructor and students will be able to look across the collected data generated and analyze them for themes and patterns.
Scholarly References
Fasse, B., & Kolodner, J. L. (2000). Evaluating classroom practices using qualitative research methods: Defining and refining the process. In Fourth international conference of the learning sciences, eds. B. Fishman and S. O’Connor Divelbiss, 193–98. Mahwah, NJ: Lawrence Erlbaum.
Francek, M. (2006). Promoting discussion in the science classroom using gallery walks. Journal of College Science Teaching, 36(1), 27-31.
Gaytan, J., & McEwen, B. C. (2007). Effective online instructional and assessment strategies. The American Journal of Distance Education, 21(3), 117-132.
Gooding, J., & Metz, B. (2011). After the lab: Learning begins when cleanup starts. Science Scope, 35(1), 29-33.
Leigh, D. (2009). SWOT analysis. In J. E. Pershing (ed.). Handbook of Improving Performance in the Workplace: Volumes 1‐3, 115-140. Pfeiffer.
Moore-Adams, B. L., Jones, W. M., & Cohen, J. (2016). Learning to teach online: A systematic review of the literature on K-12 teacher preparation for teaching online. Distance Education, 37(3), 333-348.
Oreskovic, A. (2010). Google takes aim at Microsoft with acquisition. Reuters. www.reuters.com%2Farticle%2Fus-google-idUSTRE62405X20100305&token=iD0b0oKc4WQ0jEFFcmbVgTGthoiUzyEWRF%2FX4J2v8jk%3D

