Statistics is a word that usually brings intimidation to many seasoned educators who find themselves in a doctoral program as graduate students and have not done math in years.
“The trouble with numbers is that they frighten a lot of people” (Leslie W. Rodger, as quoted in Diamantopoulos, Schlegelmilch, & Halkias, p. xxi, 2023). Diamantopoulos, Schlegelmilch, and Halkias (2023) are among many authors writing books and materials to assist anyone trying to learn statistics who classifies themselves as one with “I hate numbers syndrome” (p. xxi).
In fact, statistics anxiety is a well-researched topic and generally the genesis spawned from two culprits including test anxiety and content anxiety (Onwuegbuzie & Wilson, 2003). Amirian and Abbasi-Sosfadi (2021) augment that research with ‘help anxiety’ as an additional stressor category. Consequently, students often enter the research classroom vaguely familiar with basic central tendencies such as mean, median, and mode or even descriptives such as standard deviation or variance. However, they are often quickly intimidated by the processes inherent in performing common statistical analyses such as T-Tests, ANOVAs, Correlations, or Multiple Regressions. Case in point, running these inferential statistics using the Statistical Package for Social Science (SPSS) yields some additional initial difficulty learning the peculiarities of data entry and coding, locations of each statistical test, which options to add or not, and the seemingly endless processes within the software that produce hurdles in and within themselves. Students still have to purchase SPSS or use the free version provided by the university. Coupled with lack of familiarity or even recognizing the Greek alphabet and their matching statistical meaning, caps and small symbols, further exacerbate the initial difficulties with manually calculating each statistic. Adding to those challenges are additional post-hocs, effect sizes, and post power analyses. The bottom line is the language of statistics can be intimidating.
To cope, simply imitating YouTubers with which items to mouse click on within the variety of statistical software programs without comprehending or forging necessary connections to underlying processes behind the clicks is problematic. Students absolutely need to understand statistical foundational theories, comprehensive formulas, and the multifaceted processes of the statistical methods of application, not just how to run a statistical procedure using Excel, R, STATA, or SPSS software.
Involving students, even those at the doctoral level, with completing complicated statistical analyses by hand without support is not tantamount to sustainable understanding and certainly not mastery. Students need to work through the formulas collaboratively, with faculty support, and then learn how to perform each statistic utilizing software. This process likely yields improved mastery of the statistical processes themselves and decreases intimidation factors for students. Building efficacy and confidence within students before they use statistical software typically aids student understanding into the processes and brings less intimidation (Onwuegbuzie, & Wilson, 2003).
Link to example artifact(s)
“不闻不若闻之, 闻之不若见之, 见之不若知之, 知之不若行之” translated: “Tell me and I forget, teach me and I may remember, involve me and I learn.”
– Xun Kuang, collected approximately 818 CE
In graduate research courses within one Education doctoral program, a professor implements a gradual release strategy whereby the flipped classroom learning initiates with each student and is brought online into the classroom through socratic discussions of reasons behind theories of each statistic. Through some initial micro-lectures, 3-2-1 classwide discussions (three things learned, two ways to apply the knowledge, one way paradigm shift or aha), formulas are explained and students collaboratively solve each statistic through cooperative efforts, memory of order of operations alongside support from the instructor. This occurs synchronously online or in class on a physical or virtual whiteboard, depending on mode of delivery. Materials and resources they might need would vary depending on mode of instruction, for example access to an online whiteboard like Jamboard or something similar if it is synchronous virtual instruction.
Time needed for this mode of instruction is based on the concepts that need to be mastered. For example, mastering a t-test conceptually would take students less time than solving a complex multiple regression manually. In summary, the strategy suggested is to have students collaboratively solve the complex statistical analysis via the whiteboard and then pair learning the software analysis with this manual solving process so students understand what is happening with the software behind the scenes.
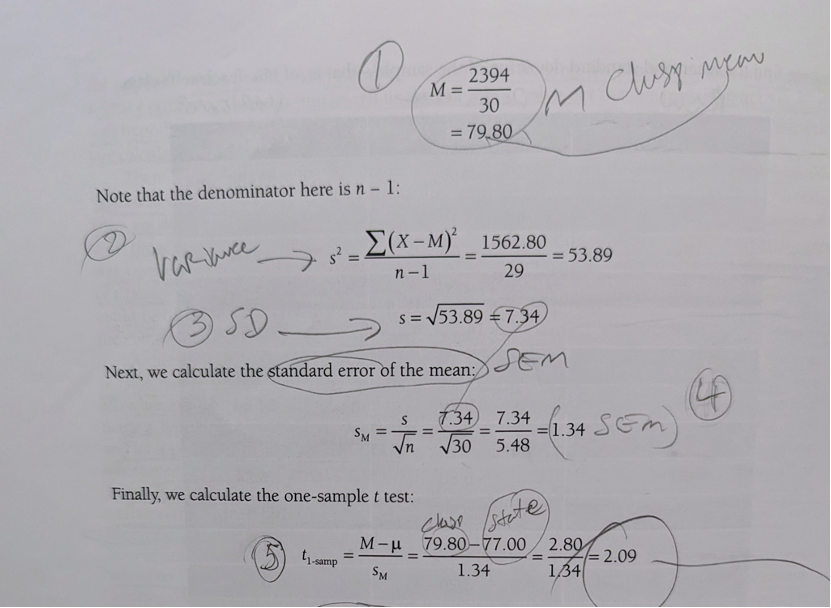
For example, the image below from the textbook used for the class shows what a breakdown of steps might look like on the board:
When graduate students are involved in these learning processes, they write formulas to individually be concertedly solved in the group setting. Solving complex statistical analyses collectively and deeply understanding that math cultivates confidence not only in the mathematics involved in the analysis, it grounds connections towards the transition to software analyses. After the theoretical and mathematical foundations are established, software performance is conducted more confidently. This is mainly because when they click through the selections in the software, such as SPSS, this time they realize internal processes occurring behind the scenes, and there is in fact not a ‘secret sauce algorithm’ running in the background. They understand the methodology from the related formulas that are behind each analysis done with the software. This enables students to remain closer to data, cultivates skill expertise and confidence in their results, and adds an accoutrement of in-depth understanding.
Unfortunately, many statistics textbooks fall short in one aspect or another. In one camp, the focus primarily lies far too theoretical with proofs and manually solving formulas is presented as the utmost important. Conversely, other texts embrace teaching one particular statistical software and all steps involved in running each. Thus, it truly is challenging to find the perfect textbook that uses an effective blend that informs readers about statistics and through statistical procedures via software analysis. One textbook that attempts a balance of formula and software practice is Statistics Alive! (Steinberg, 2020). This is the text used in some graduate Education research courses. Whereas, the textbook alone is excellent with theory and practice downloadable datasets to match each statistical test so students can practice on their own anytime, anyplace, and anywhere. This is an excellent text to gently warm students up to learning and performing statistical analyses, yet still falls far short regarding the all-important assumption testing procedures. This can be easily supplemented with website subscriptions such as LAERD.com where statistical procedures by steps from start to finish are available.
Beyond learning foundational statistical theory, proofs, formulas, and software for analyses, graduate students need to know when to use a particular statistical tool, caveats to application, and most importantly, interpretation. The latter invariably stumbles even advanced students, i.e.: accepting alternative hypotheses, failing to reject false null hypotheses and type I and II errors. When less intimidating and non-threatening andragogy is effectively implemented into the learning processes, students are very appreciative and teaching research can be fun when they grasp the wide-reaching application and benefits they can use with the new knowledge and skills they acquire. In grasping when to use each statistic and the most appropriate statistic for their research questions, the light goes on! Further, when output analysis results are exhibited, much guidance is needed with guiding students in specifically using statistical language to properly display and write their findings accurately. The more they practice the entire process from obtaining survey results or database downloads in Excel, uploading data files into statistical software, coding data within the software program, checking data assumptions, running statistical procedures, and displaying and writing results with APA the more they grow in confidence and the stronger researchers they become as they progress with writing their dissertations, program evaluation analyses, grant applications, and a variety of methodological research. It all starts and ends with demystifying research through refined andragogy with flipped classrooms and mico-lectures, collaborative problem solving and online software data analysis activities, and most importantly involving students throughout the entire learning process.
This strategy and concept could extend beyond the statistics classroom into other complicated concepts within STEM fields. Any concept or equation that is intimidating to students and that can be solved on a whiteboard would work for this strategy as it is centered around removing the overwhelming anxiety through the power of collaborative problem solving.
Link to scholarly reference(s)
Amirian, S. M. R., & Abbasi-Sosfadi, S. (2021). Fear of statistics among TEFL postgraduate students. Eurasian Journal of Applied Linguistics, 7(1), 202-221.
Diamantopoulos, A., Schlegelmilch, B. B., & Halkias, G. (2023). Taking the fear out of data analysis. Books.
Kuang, Xun, approximately 818 CE, English translation from 1929. “The Teachings of the Ru -Book 8.” Chapter 11.
Onwuegbuzie, A. J., & Wilson, V. A. (2003). Statistics Anxiety: Nature, etiology, antecedents, effects, and treatments–a comprehensive review of the literature. Teaching in higher education, 8(2), 195-209.
Steinberg, W. J. (2020). Statistics Alive! Third Edition. Sage Publications, Inc.
Citation
Eadens, D.W., & Pratt, D.M. (2023). Demystifying Statistics for Doctoral Students in Education Using Collaborative Whiteboards. In deNoyelles, A., Bauer, S., & Wyatt, S. (Eds.), Teaching Online Pedagogical Repository. Orlando, FL: University of Central Florida Center for Distributed Learning.